# The Complete Guide to Running the Glance Dashboard in Docker
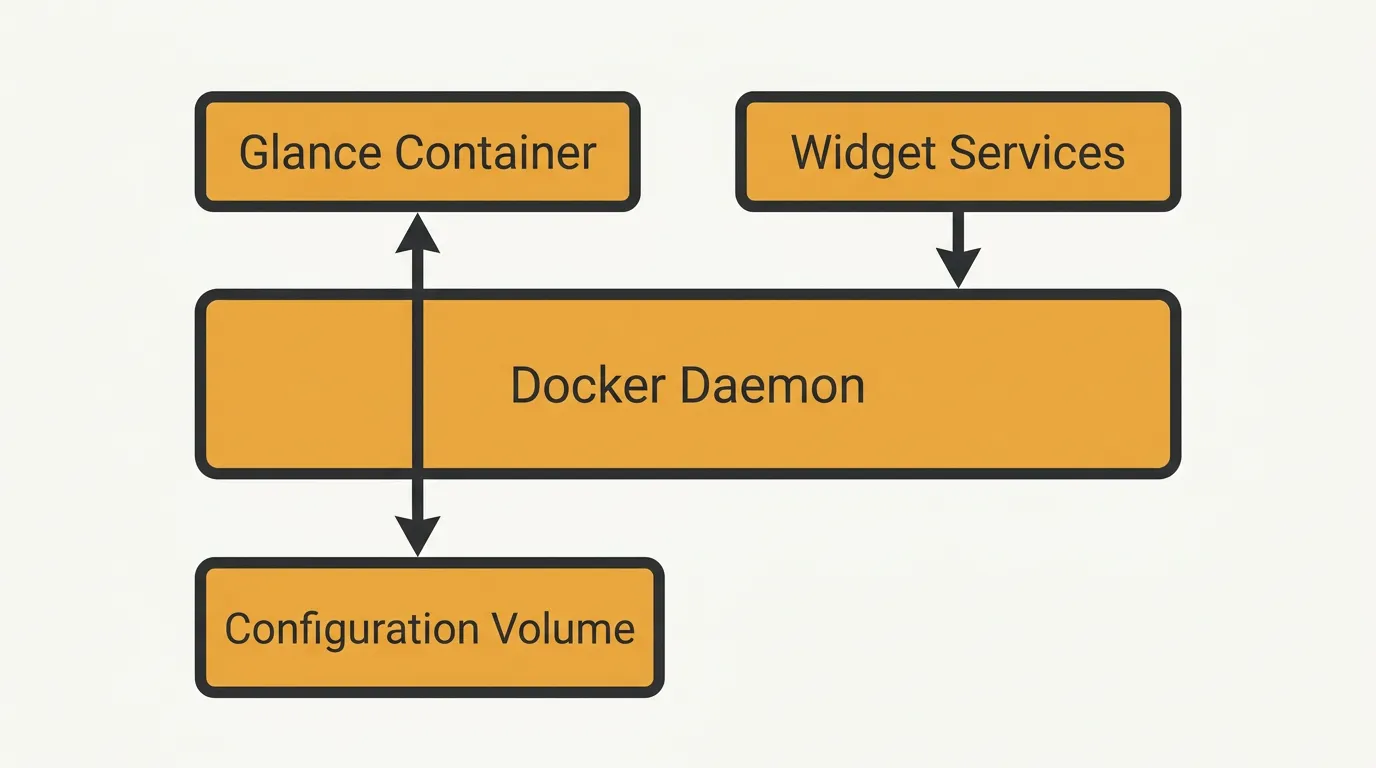
Self-hosted dashboards used to mean heavy Java apps, a database, and a lost weekend of tinkering. Glance changes that. It's a single Go binary that pulls your feeds, server stats, bookmarks, weather, and container status into one fast page — and it runs comfortably on a Raspberry Pi.
Running Glance in Docker is the shortest path to a working dashboard. One image, one YAML file, one command. But most people get stuck on what happens after docker compose up: how to keep the config organized, how to run it on a NAS, and how to reach it from your phone when your home connection sits behind carrier-grade NAT (CGNAT).
This guide covers the whole journey. You'll get a working Glance container, a sane config structure, deployment notes for real hardware, and a clear comparison between reverse proxies and zero-trust relays for public access.
## What Is Glance and Why Run It in Docker?
Glance is an open-source, self-hosted dashboard that puts many small widgets on one configurable page. Instead of opening ten tabs every morning, you open one. Typical widgets include:
- RSS feeds from blogs and news sites
- Reddit and Hacker News posts
- Weather forecasts for your location
- Bookmarks grouped into tidy columns
- Monitor widgets that show whether your other services are up
- Docker containers status, read from the Docker socket
- GitHub releases for projects you follow
- Markets for stocks and crypto tickers
- Custom API widgets that render any JSON endpoint you point them at
- Clock, calendar, search bar, and video feeds
The project is written in Go and ships as a compiled binary with assets built in. That design matters more than it sounds. There's no Node runtime, no Python virtualenv, no Postgres, no Redis. Memory use typically sits in the tens of megabytes, and pages render in milliseconds.
Why Docker is the right way to run it
You can download the binary and run it directly. But for most people, Docker is still the better default:
- Reproducibility. The image bundles the exact runtime. Upgrades are a
docker compose pullaway, and rollbacks are just a tag change. - Clean config boundaries. Your YAML lives on the host. The container stays disposable.
- Multi-architecture support. The official image builds for both x86-64 and ARM64, so the same Compose file works on a mini PC, a NAS, and a Raspberry Pi 4 or 5.
- Easy integration. Mounting the Docker socket read-only lets Glance display your other containers. Joining a shared Docker network lets Glance monitor them by hostname.
- Restart policies.
restart: unless-stoppedmeans the dashboard comes back after a power cut without you having to log in and restart it.
If you already run a handful of self-hosted services with Compose, adding Glance is a five-minute job — and it quickly becomes the front door to everything else you host.
## Docker Compose Setup: Getting Glance Running in Minutes
Here's the minimal working setup. Create a folder, add a Compose file, add a config file, and start it.
1. Create the project directory
mkdir -p ~/glance/config
cd ~/glance
Keeping the config in its own subdirectory pays off later, when you split one YAML file into several.
2. Write docker-compose.yml
services:
  glance:
    image: glanceapp/glance:latest
    container_name: glance
    restart: unless-stopped
    ports:
      - "8080:8080"
    volumes:
      - ./config:/app/config
      # Optional: let the Docker widget read container status
      - /var/run/docker.sock:/var/run/docker.sock:ro
    environment:
      - TZ=Europe/Berlin
A few notes on those lines:
- Port 8080 is the default Glance listen port inside the container. Change only the left side (
"3000:8080") if 8080 is already taken on your host. - The config volume maps your host folder to
/app/config, where Glance looks forglance.yml. - The Docker socket is optional and read-only. Skip it unless you plan to use the container widget — anything with socket access can see a lot about your host. If you want that widget with less exposure, put a socket proxy in front of it.
TZkeeps clocks, calendars, and timestamps accurate.
3. Add a starter config
Create config/glance.yml:
pages:
  - name: Home
    columns:
      - size: small
        widgets:
          - type: clock
            hour-format: 24h
            timezones:
              - timezone: America/New_York
                label: New York
          - type: weather
            location: Berlin, Germany
            units: metric

      - size: full
        widgets:
          - type: hacker-news
            limit: 15
          - type: rss
            title: Blogs
            limit: 12
            feeds:
              - url: https://example.com/feed.xml
                title: Example Blog

      - size: small
        widgets:
          - type: bookmarks
            groups:
              - title: Self-Hosted
                links:
                  - title: Router
                    url: http://192.168.1.1
4. Start it
docker compose up -d
docker compose logs -f glance
Open http://localhost:8080 (or http://<server-ip>:8080) and your dashboard is live. The logs are worth watching the first time — Glance reports YAML errors clearly, right down to the offending line.
Everyday commands
# Reload after editing config (recent versions also auto-reload on change)
docker compose restart glance

# Update to the newest image
docker compose pull && docker compose up -d

# Validate what the container sees
docker compose exec glance ls -la /app/config
## Configuring config.yml: Widgets, Pages, and Layout
Almost all of Glance lives in configuration. Understanding four concepts gets you 90% of the way there.
Pages, columns, and widgets
The hierarchy is simple: a config has pages, each page has columns, and each column has widgets.
Columns come in two sizes: small and full. A page needs at least one full column, and the common layouts are:
fullonly — a single wide columnsmall+full— sidebar plus main contentsmall+full+small— the classic three-column dashboard
Add more pages for different contexts: a Home page for news and weather, an Infra page for monitors and container status, a Media page for your library links. Pages show up as tabs in the navigation.
pages:
  - name: Infra
    columns:
      - size: full
        widgets:
          - type: monitor
            cache: 1m
            title: Services
            sites:
              - title: Nextcloud
                url: https://cloud.example.com
              - title: Jellyfin
                url: http://192.168.1.50:8096
          - type: docker-containers
Monitor and Docker widgets: the self-hoster's favorites
The monitor widget sends periodic requests to URLs you list and shows green or red status with response times. It's the fastest uptime board you'll ever set up.
The docker-containers widget reads the mounted socket and lists running containers. You can add labels to your other containers to control how they appear, which keeps the dashboard tidy without hardcoding names in the YAML.
Grouping and splitting for density
Two structural helpers keep long pages readable:
groupputs several widgets behind tabs in the same slot, so three RSS feeds can share one card.split-columnturns onefullcolumn into two narrower stacks.
- type: group
  widgets:
    - type: reddit
      subreddit: selfhosted
    - type: reddit
      subreddit: homelab
Secrets, environment variables, and includes
Never paste API keys directly into a file you might commit. Glance reads environment variables in config values using ${VARIABLE} syntax, so you can pass them through Compose:
# docker-compose.yml
environment:
  - MY_API_KEY=${MY_API_KEY}
# glance.yml
- type: custom-api
  title: My Service
  url: https://api.example.com/status
  headers:
    Authorization: Bearer ${MY_API_KEY}
Store the real values in a .env file next to your Compose file, and keep that file out of version control.
Once your config passes a few hundred lines, split it up. Glance supports including other files, so you can keep home.yml, infra.yml, and media.yml in the same config folder and reference them from the main glance.yml. Your Git history stays readable.
Theming and server settings
A theme block controls colors using HSL values, and a server block controls the listen host, port, and base URL. If you plan to serve Glance from a subpath behind a proxy, check the base URL setting first. Consult the project's configuration docs for the exact keys in your version, since widget options do evolve between releases.
Authentication
Glance has picked up more security features over time, including optional built-in authentication in recent versions. Pin your image to a known tag, read the release notes for your version, and never assume an internet-facing dashboard is private by default. If your version doesn't support auth the way you need, handle authentication in the layer in front of Glance — which is exactly what the next section covers.
## Real-World Deployments: Home Servers, NAS, and Raspberry Pi
Glance's small footprint means the hardware question usually boils down to "what do I already own?"
Home server or mini PC
This is the easiest case. Install Docker Engine, drop the Compose file in /opt/glance, and start it. If you already run several services, put Glance on the same user-defined Docker network so monitor widgets can use container names instead of IP addresses:
services:
  glance:
    image: glanceapp/glance:latest
    networks:
      - homelab
networks:
  homelab:
    external: true
Then a monitor URL like http://jellyfin:8096 resolves inside Docker, and nothing breaks when your LAN DHCP leases change.
NAS devices (Synology, QNAP, Unraid, TrueNAS)
Most NAS platforms ship a container manager that accepts Compose files or lets you define a container through a form. Watch out for three things:
- Path mapping. Use the NAS's real share path for the config volume, such as
/volume1/docker/glance/config. - Port conflicts. NAS web UIs often claim 8080 already. Map to something like
3080:8080instead. - File ownership. If the container can't read your YAML, check the file's user and group on the share.
A NAS is a great host for Glance because it's already running 24/7 and already holds your other services.
Raspberry Pi
A Pi 4 or Pi 5 runs Glance without breaking a sweat, and even a Pi Zero 2 W can handle a modest dashboard. The official image supports ARM64, so there's no special build needed — just run the same Compose file on a 64-bit Raspberry Pi OS install.
Two practical tips for Pi deployments:
- Use an SSD or a good A2 card. Glance itself writes very little, but Docker image pulls and log files will punish cheap SD cards over time.
- Cap your widget refresh rates. Every widget with a
cachesetting controls how often it fetches new data. Longer caches (cache: 30mfor news,cache: 1hfor weather) cut down on network chatter and keep you inside third-party API limits.
# Check resource use on constrained hardware
docker stats glance --no-stream
You'll usually see a small fraction of a CPU core and modest memory use — which is exactly why Glance fits so well on low-power boxes.
The CGNAT problem
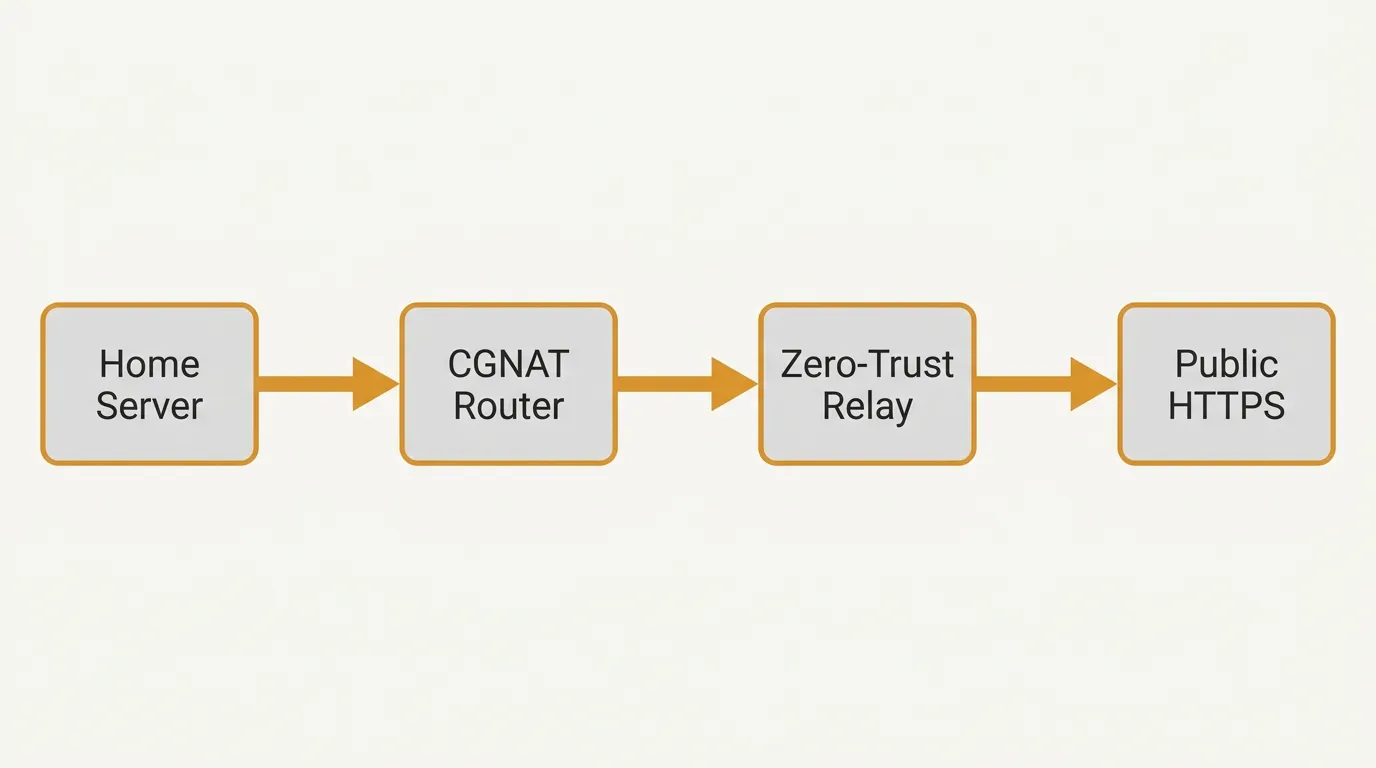
Here's where most home deployments hit a wall. Many internet connections — mobile broadband, some fiber providers, most Starlink installs — sit behind CGNAT. That means you share a public IP with other customers, and there's no port to forward, because you don't own a public address. Your Pi dashboard works perfectly at home and is invisible from anywhere else.
That one constraint shapes everything about publishing Glance, which brings us to the next section.
## Exposing Glance Publicly: Reverse Proxies vs. Zero-Trust Relays
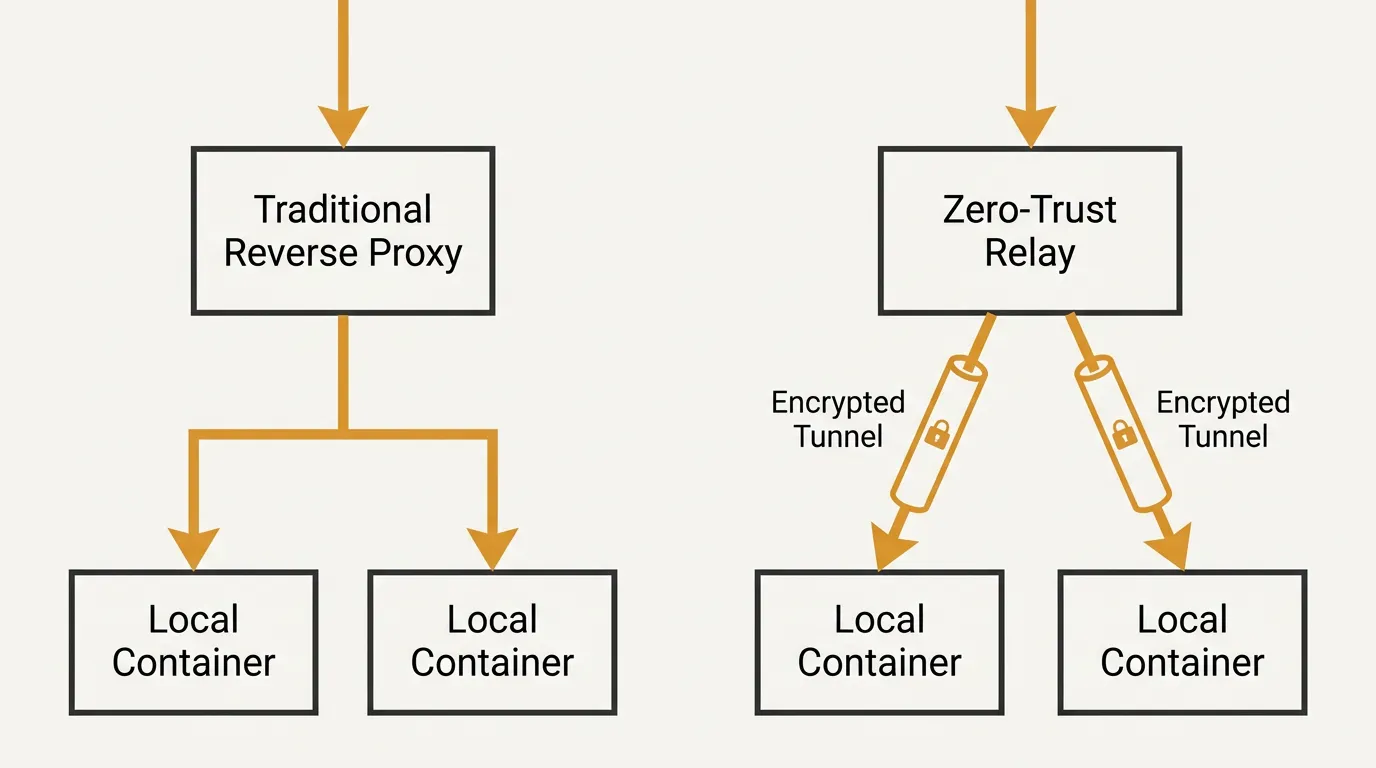
You have a dashboard on port 8080. Now you want it on your phone, from a café, over HTTPS. There are two fundamentally different ways to get there.
Option 1: Classic reverse proxy with port forwarding
The traditional homelab approach:
- Run a reverse proxy (Caddy, Nginx, or Traefik) on your server.
- Point a domain at your home IP, usually with dynamic DNS since that IP changes over time.
- Forward ports 80 and 443 on your router to the proxy.
- Let the proxy request TLS certificates and terminate HTTPS.
- Add authentication in front of Glance.
When it works well: you have a real public IP, control of your router, and comfort with certificates and firewall rules.
What it costs you:
- It can't work behind CGNAT. No public IP means no port forwarding.
- You open inbound ports. Every open port is attack surface you now have to maintain.
- Dynamic DNS adds a moving part. IP changes, propagation delays, and stale records all cause outages.
- You own the TLS lifecycle. Renewals, challenge types, and proxy config drift become your problem.
- ISP terms may forbid it. Many residential contracts prohibit running public servers.
Option 2: Zero-trust relay with outbound-only connections
The modern alternative flips the direction of traffic. An agent on your server makes an outbound connection to a relay. Public requests arrive at the relay and travel back down that existing tunnel to your container.
Why this matters:
- No inbound ports. Your router firewall stays closed. There's nothing to scan.
- CGNAT is irrelevant. Outbound connections always work, which is why your Pi can browse the web in the first place.
- No dynamic DNS. The relay holds a stable hostname while your home IP changes freely.
- TLS is handled for you. You get an HTTPS URL without managing certificates yourself.
- Least privilege by default. You publish one service on one port, not your whole network.
The tradeoff is that traffic passes through a relay, which adds a small amount of latency and makes the relay part of your availability chain. For a personal dashboard, that tradeoff is almost always worth it — you swap a permanent hole in your firewall for a managed outbound connection.
A sensible middle path
Many people run both. Inside the LAN, they reach Glance directly at http://server:8080 for the lowest latency. Outside, they use a relay with authentication in front. Same container, two access paths, no exposed ports.
## Glance vs. Traditional PaaS Dashboards
The word "dashboard" causes real confusion here, so let's separate two very different things.
Glance is an information dashboard. It aggregates and displays feeds, weather, bookmarks, uptime checks, and container lists. It doesn't build your code, run your databases, or manage deployments. It's a read-mostly window onto things that already exist.
A PaaS control panel is a management dashboard. Platforms like the self-hosted app-platform tools you may already know exist to build images from source, run databases, handle rollbacks, and route traffic. Their dashboards are consoles for operating infrastructure, not just viewing it.
Comparing the two directly is a category error — but the comparison people actually care about is this: do you need a full PaaS stack just to deploy something as small as Glance?
| Consideration | Glance in plain Docker | Full self-hosted PaaS |
|---|---|---|
| Components to run | One container | Control plane, database, build service, proxy, often more |
| Baseline memory | Tens of MB | Typically hundreds of MB to GB |
| Setup time | Minutes | Hours, plus ongoing maintenance |
| Runs well on a Pi | Yes | Frequently a struggle |
| Git-push deploys | Not built in | Yes |
| Public HTTPS | You add it | Usually included |
| Operational burden | Very low | Real and continuous |
The honest answer: a heavyweight platform is overkill for one small dashboard, but plain Docker leaves the hard parts — public access, HTTPS, repeatable deploys — as homework you still have to do. If you want the deployment workflow without the platform weight, our guide on application deployment from Git push to production on any hardware walks through how modern deploy pipelines work on hardware you already own.
## Deploying Glance Without Manual Docker Management
Plain Compose works fine when you have one server and one dashboard. It gets tedious once real life shows up. A typical Glance lifecycle looks like this:
- Edit
glance.ymlon your laptop. - Copy it to the server over SCP or rsync.
- SSH in and restart the container.
- Realize you broke the YAML and repeat the whole process.
- Figure out separately how to publish it over HTTPS.
Every step here is manual, and none of it is version controlled unless you build that yourself.
A better workflow treats the dashboard as a small application:
- Config lives in Git. Your
glance.yml, includes, and Compose file sit in a repository. Changes are reviewable and reversible. - Deploys happen on push. You commit, push, and the running container updates. No SSH, no rsync.
- Public HTTPS is automatic. The URL exists as soon as the service runs, with certificates handled for you.
- CGNAT doesn't block you. An outbound-only agent means the hardware can be a Raspberry Pi on a mobile connection.
- Rollback is a revert. Broken YAML goes away with
git revertinstead of frantic editing over SSH.
That's the same discipline teams apply to production services, applied to a dashboard that happens to live in your living room. The hardware stays yours, so there are no per-container fees and no vendor limits on what you run — you only outsource the annoying parts: build, route, and certificate management.
Ready to deploy your Glance dashboard beyond localhost? Use Piper to git push it to your own hardware—home server, NAS, or Raspberry Pi behind CGNAT—and get a public HTTPS URL automatically.
## Frequently Asked Questions
Is Glance the same as Glances (nicolargo/glances)?
No. These are two separate projects with confusingly similar names.
- Glance (the subject of this guide) is a self-hosted information dashboard written in Go. It shows RSS feeds, weather, bookmarks, uptime monitors, container lists, and similar widgets on a configurable page.
- Glances (
nicolargo/glances) is a system monitoring tool written in Python. It shows CPU, memory, disk, network, and process metrics in a terminal or a simple web view, similar totoporhtopwith more detail.
Both are good tools, and people often run both: Glances for deep host metrics, Glance as the front page that links to everything. When searching for help, include the trailing "s" or the project author's name to land on the right documentation.
What's the easiest way to run Glance with Docker?
Docker Compose with a mounted config directory. Create a folder, add a docker-compose.yml that pulls glanceapp/glance:latest, map port 8080, and mount ./config:/app/config. Put a minimal glance.yml in that config folder with one page, one full column, and one widget. Then:
docker compose up -d
Start small and add widgets one at a time. A single bad indentation in YAML can stop the whole dashboard, so incremental changes plus docker compose logs -f glance will save you time.
Can I run Glance on a Raspberry Pi behind CGNAT?
Yes, on both counts.
Glance runs well on ARM64 hardware, and the official image supports that architecture, so a 64-bit Raspberry Pi OS install needs no special setup. Resource use is modest enough that a Pi 4 handles a full dashboard with room to spare.
CGNAT doesn't prevent Glance from running — it only blocks inbound connections from the internet. On your home network, the dashboard works normally. To reach it from outside, use an outbound-only relay or tunnel instead of port forwarding, since there's no public IP to forward from. That's exactly the scenario zero-trust relay deployment is built to solve.
How do I expose my self-hosted Glance dashboard securely?
Follow a few rules regardless of the method you pick:
- Don't open port 8080 to the internet directly. Always put HTTPS termination and access control in front of it.
- Prefer outbound-only tunnels over port forwarding. No inbound ports means no inbound attack surface, and it works behind CGNAT.
- Add authentication. Use Glance's built-in auth if your version supports it, or enforce it at the proxy or relay layer.
- Keep secrets in environment variables. Reference them in the config with
${VAR}so keys never end up in Git. - Mount the Docker socket read-only, or not at all. Skip it entirely if you don't need the container widget.
- Pin and update your image tag. Pin a version for stability, then update deliberately after reading release notes.
Do I need a full PaaS platform just to run Glance?
No. Glance is one lightweight container with one YAML file. Running a complete platform — control plane, database, build workers, proxy — just to host a single small dashboard adds far more maintenance than it removes, and heavy platforms often strain small hardware like a Raspberry Pi.
What you do want are the useful parts of a platform: Git-based deploys, automatic HTTPS, and public access that works behind CGNAT. Those can be added without adopting a whole PaaS stack, which is the practical sweet spot for most self-hosters.
## Bringing It All Together
Glance earns its popularity the honest way: it's small, fast, and configured entirely in readable YAML. Running Glance in Docker takes one Compose file and a few widgets, and it scales down to hardware as modest as a Raspberry Pi without complaint.
The interesting engineering work isn't the container — it's everything around it. Organize your config in Git and split it into includes before it sprawls. Keep API keys in environment variables. Pick your public access method based on your network reality, not tradition: if you sit behind CGNAT, an outbound-only relay isn't a workaround, it's the correct architecture. And resist the urge to install a heavyweight platform when all you really need is a repeatable deploy and a working HTTPS URL.
Start with the minimal Compose file from this guide, add one widget at a time, and let the dashboard grow into the front page of your homelab.